Traffic without another tool
Visits per page and per day, counted by the platform itself.

Create & design
AI generation Visual editor HTML code mode Template galleryGrow & sell
Online store Blog & SEO Forms & leads CRM AnalyticsScale up
Custom domain Multi-language Team & roles White label See all featuresTraffic and content, lead conversion, products per order and revenue, product trends, transactions, period analysis, timeline, abandoned carts and AI usage. Percentages come back empty rather than zero when there is nothing to divide — a fake 0% is worse than a blank.
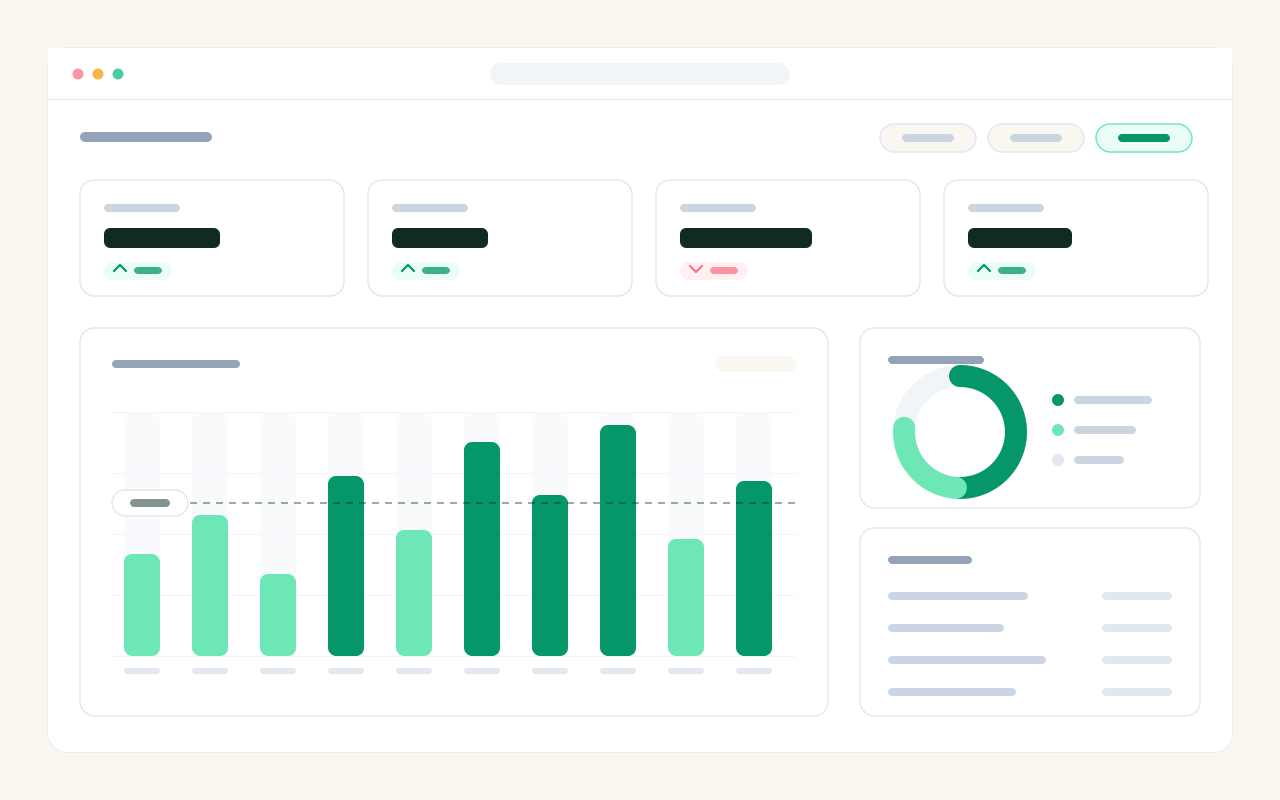
Visits per page and per day, counted by the platform itself.
See how many visitors became leads and how many became orders, each measured against visits.
Products ranked by orders and revenue, with trend over time and margin where you entered a cost.