
Aperçu du modèle
Ouvrir en plein écran ↗
Général
Customer Case Study
« Utiliser » ouvre le tableau de bord PageHub pour démarrer à partir de ce modèle.
- Catégorie
- Général
- Type
- Landing page
- Publié
- 16 novembre 2026
- Utilisé
- Jamais utilisé
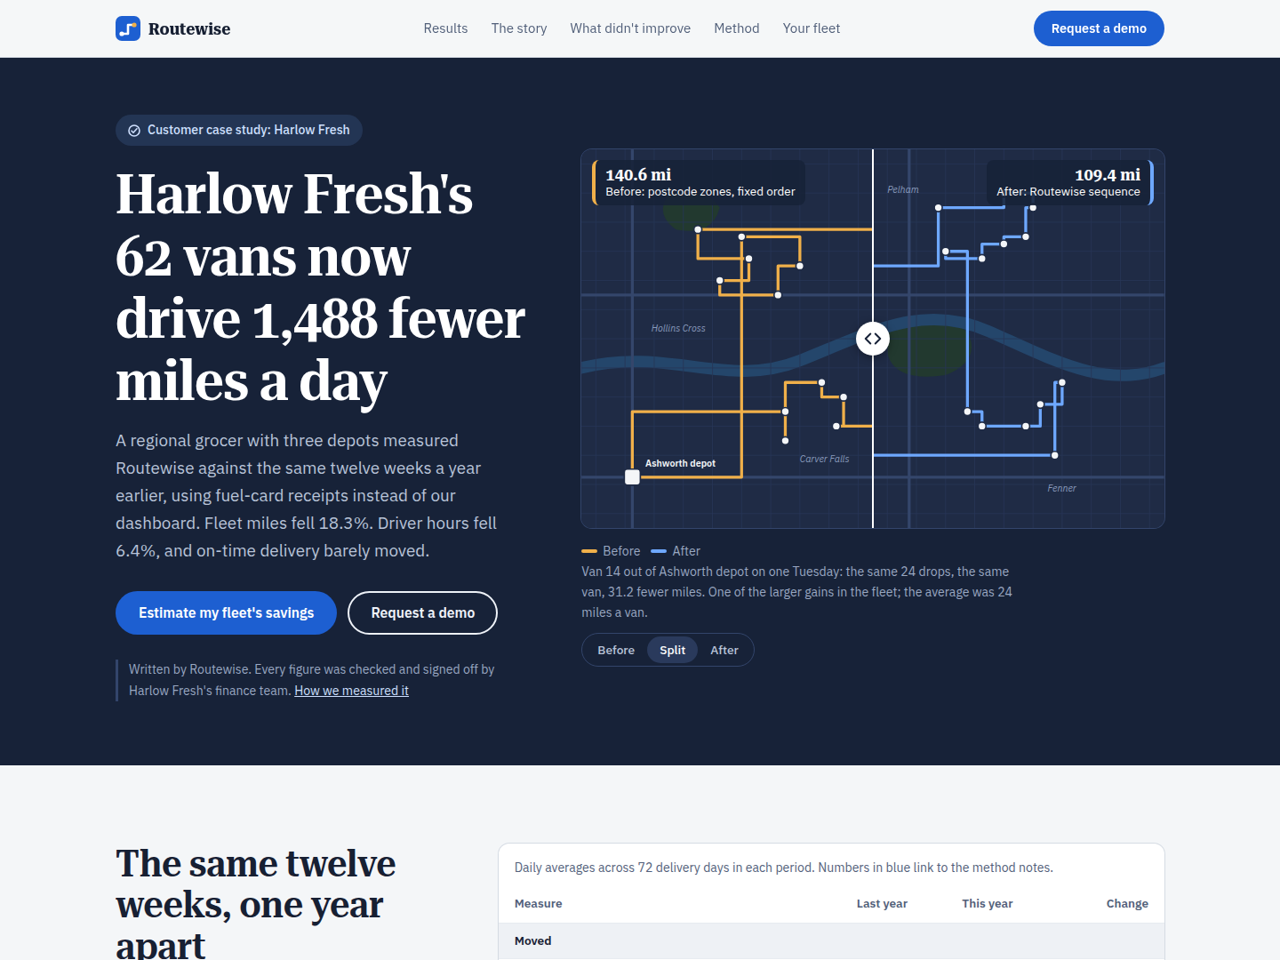
Customer Case Study is a landing page for a B2B company that wants to sell with one customer's measured results instead of a logo wall. It is written as data journalism: a route-planning vendor, Routewise, shows how a regional grocer, Harlow Fresh, cut its delivery miles, with every figure traceable to a method note, and with the results that did not improve left on the page.
Sections, in order
Sticky navbar with anchors and a demo button.
Hero with the headline result and a before/after route map: drag the slider (or press Before / Split / After) to compare one van's day under the old zone order and the new sequence.
Results table: last year against this year, grouped into what moved, context, and what did not move, with footnote links and an annual summary.
The story: how the routes got long, two pull quotes from named staff, and a sidebar with fleet facts and a diagram of the old zone order.
Annotated weekly chart showing the rollout making things worse before better.
What did not improve: driver hours, on-time rate and failed deliveries, each with a sparkline, plus a critical quote from a driver.
Method notes: seven numbered footnotes on the comparison period, order growth, fuel data, emissions factor, exclusions, annual figures and disclosure.
Savings calculator: fleet size, distance, fuel economy, fuel price and current routing method give a cautious savings range, the licence cost and the net, with miles/gallons or km/litres. It says plainly when the software would not pay for itself.
Demo request form with a three-step explanation of what happens next, and a simple footer.
Design and style. Night-blue hero and calculator around a cool paper-grey article, Roboto Serif headlines in a narrowed width over IBM Plex Sans, tabular figures, ochre for the old route and blue for the new. Charts and maps are inline SVG; the slider, calculator and mobile menu are vanilla JavaScript.
Before you publish. Replace the case-study numbers everywhere together: the table, the annual summary, the chart, the map labels and the calculator's comparison line all quote the same figures. The calculator's savings ranges and licence price are constants at the top of the script. The calculator is not a form, so nothing typed into it is stored; only the demo form becomes a lead.
Best suited to B2B software and service companies, logistics, energy, operations and finance tools, and any seller whose buyers ask for proof and a method.
Sections, in order
Sticky navbar with anchors and a demo button.
Hero with the headline result and a before/after route map: drag the slider (or press Before / Split / After) to compare one van's day under the old zone order and the new sequence.
Results table: last year against this year, grouped into what moved, context, and what did not move, with footnote links and an annual summary.
The story: how the routes got long, two pull quotes from named staff, and a sidebar with fleet facts and a diagram of the old zone order.
Annotated weekly chart showing the rollout making things worse before better.
What did not improve: driver hours, on-time rate and failed deliveries, each with a sparkline, plus a critical quote from a driver.
Method notes: seven numbered footnotes on the comparison period, order growth, fuel data, emissions factor, exclusions, annual figures and disclosure.
Savings calculator: fleet size, distance, fuel economy, fuel price and current routing method give a cautious savings range, the licence cost and the net, with miles/gallons or km/litres. It says plainly when the software would not pay for itself.
Demo request form with a three-step explanation of what happens next, and a simple footer.
Design and style. Night-blue hero and calculator around a cool paper-grey article, Roboto Serif headlines in a narrowed width over IBM Plex Sans, tabular figures, ochre for the old route and blue for the new. Charts and maps are inline SVG; the slider, calculator and mobile menu are vanilla JavaScript.
Before you publish. Replace the case-study numbers everywhere together: the table, the annual summary, the chart, the map labels and the calculator's comparison line all quote the same figures. The calculator's savings ranges and licence price are constants at the top of the script. The calculator is not a form, so nothing typed into it is stored; only the demo form becomes a lead.
Best suited to B2B software and service companies, logistics, energy, operations and finance tools, and any seller whose buyers ask for proof and a method.
Aucun avis pour l'instant. Les avis viennent de ceux qui ont réellement utilisé ce modèle.